Some time ago, at around the outbreak of Covid, I shared a simple tool for quickly identifying operators in a given tech space using the CPC coding system and the USPTO API.
Around that time, I also began developing an internal tool that helps me to do deep research dives on companies. That tool has since grown, cross-referencing EDGAR, PACER, and USPTO data, to create a monolithic picture of an entity.
While I can't share the entirety of that tool on the web (it's not terribly user friendly or scalable), I was trying to convince a finance friend over the holidays that, despite USPTO databases errors/omissions, the part of the tool comparing portfolios on just CPC categories can be pretty illuminating in itself.
To share the argument more widely as yet another public service, I did a super-quick PHP implementation of the functionality.
You can try it here (preloaded with some Oceaneering and Tesla Motors data).
(Be patient if you want to do a new search. I haven't added a progress bar, but it can take a minute or so for a big search. I've also capped the number of searches you can do to avoid overloading the USPTO server)
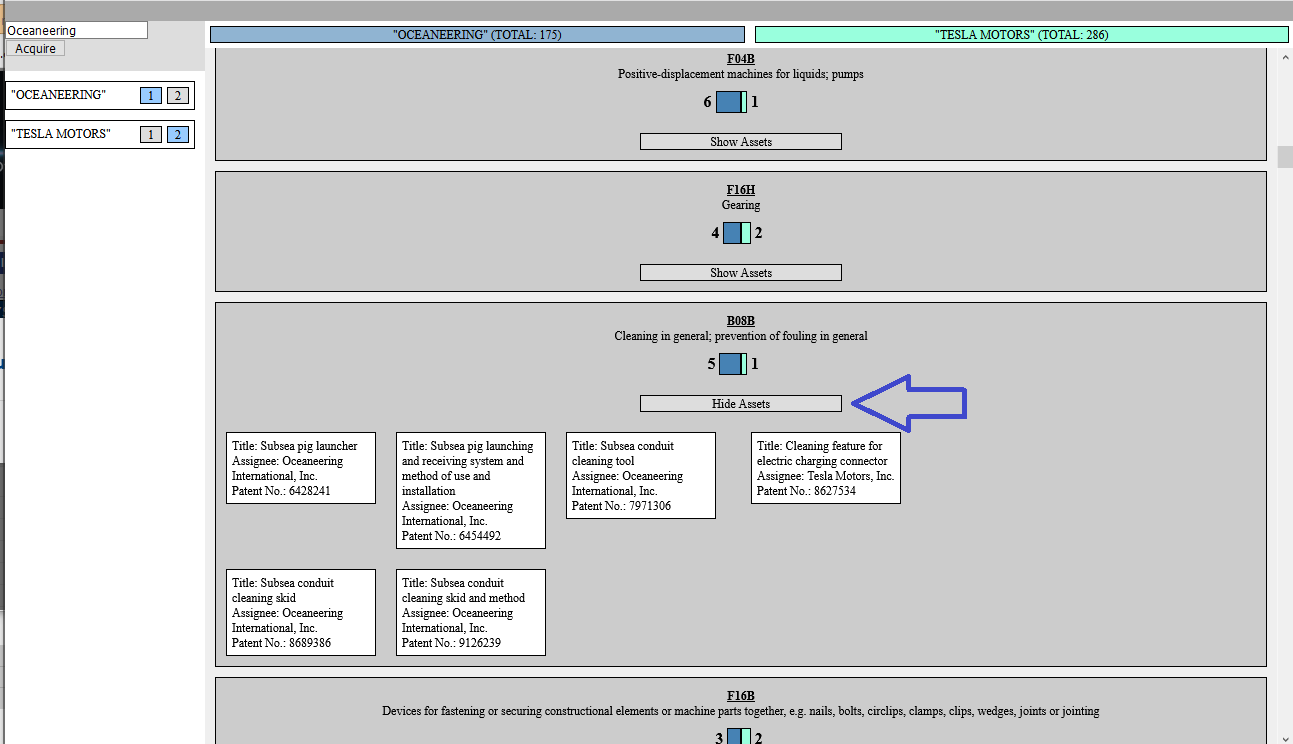
Here's a screenshot of what you'll see:
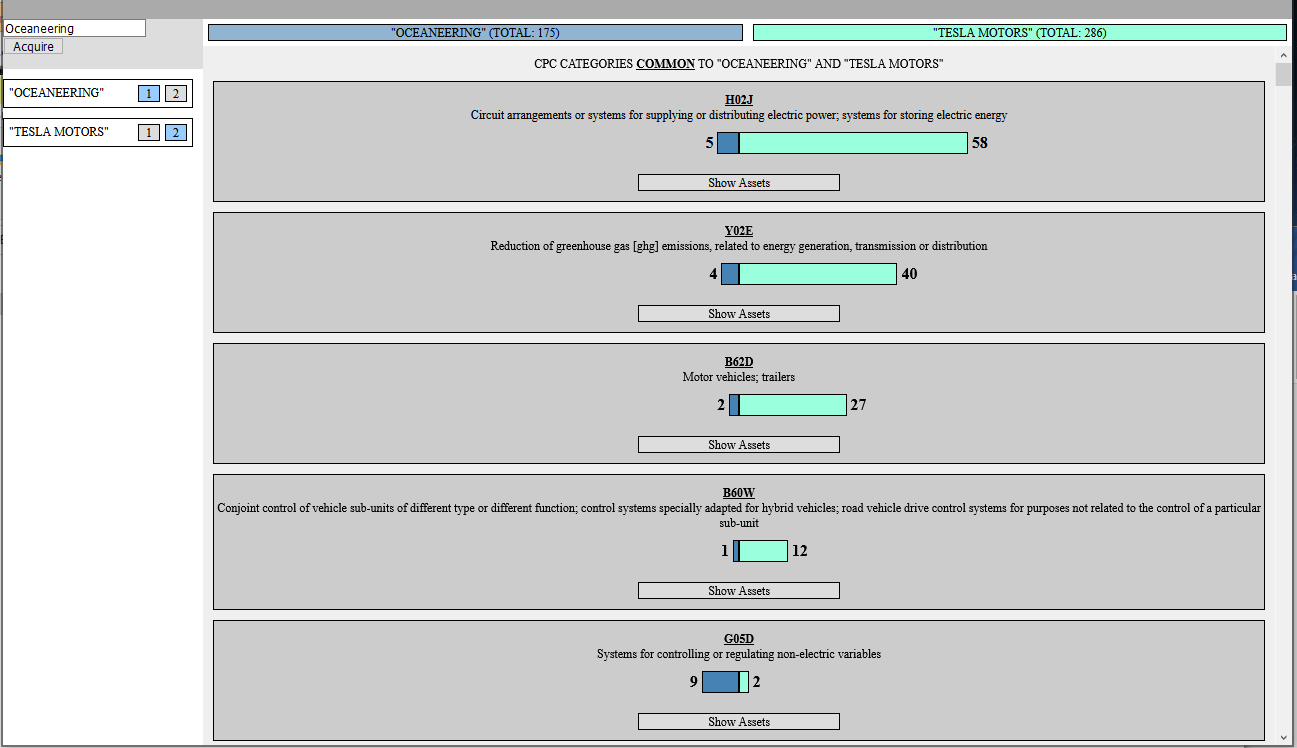
And a summary of what you're looking at:
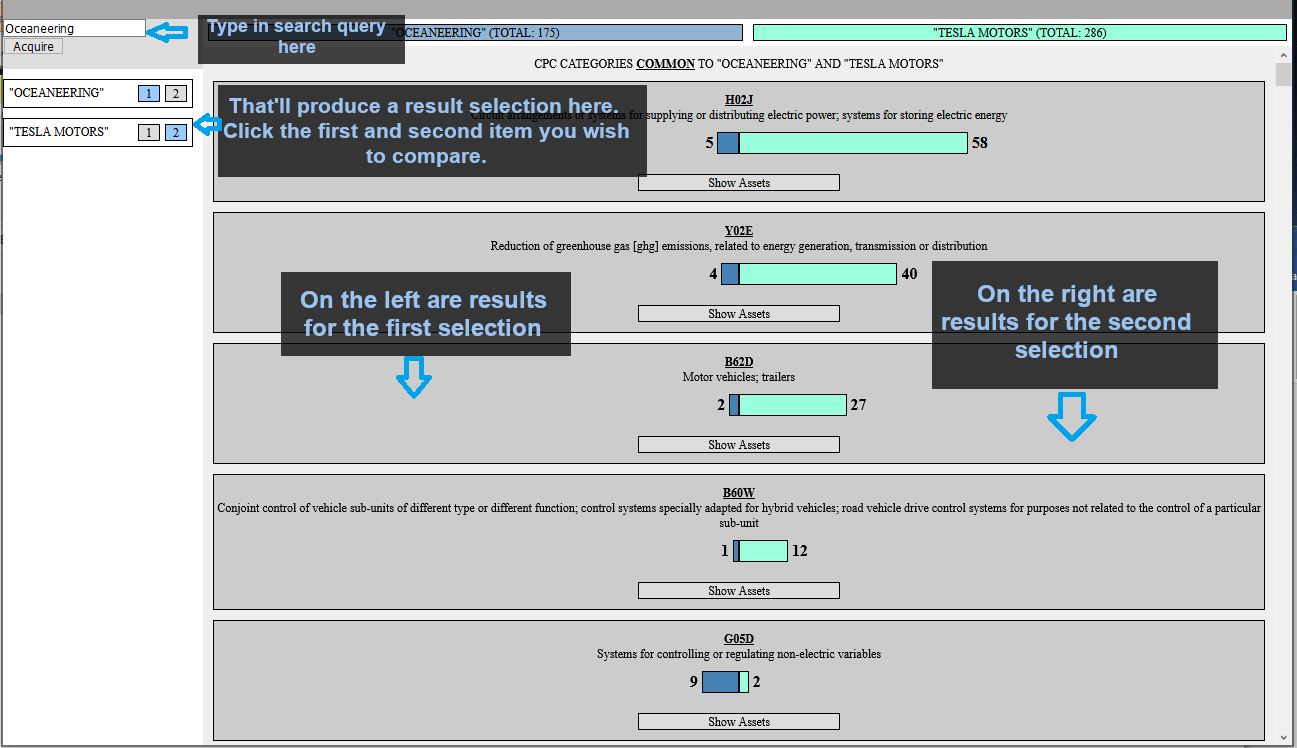
Basically, the system just runs the search term query through the assignments USPTO API, then identifies the returned assets and their CPCs. Later, when you compare two search results, the system will list the total number of returned assets (see the "Totals" at the top) and then a CPC breakdown.
"Wait, I see many more assets in the CPC breakdown than in the total number of assets."
Yeah, one asset can fall into multiple CPC categories.
The demo first lists the CPCs *COMMON* to both the search results as shown above. If you scroll down . . .
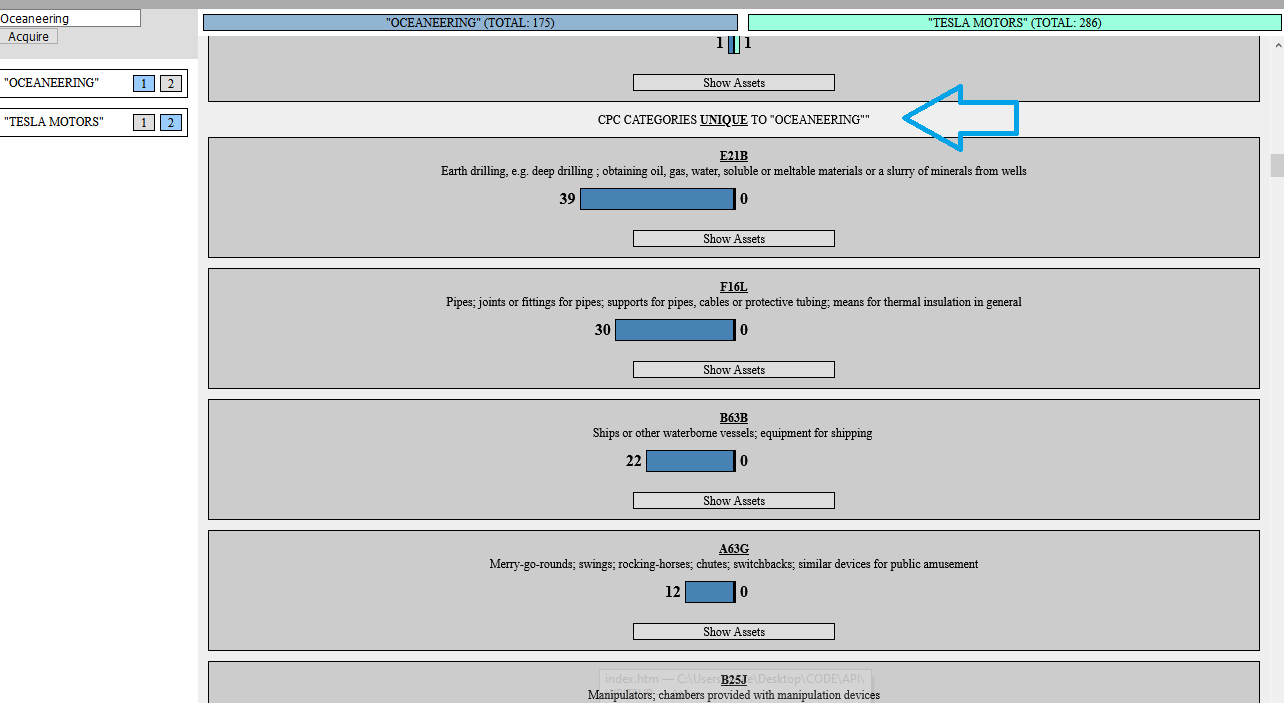
You'll see that it then lists the CPC results unique to ONLY the first query. If you scroll further down . . .
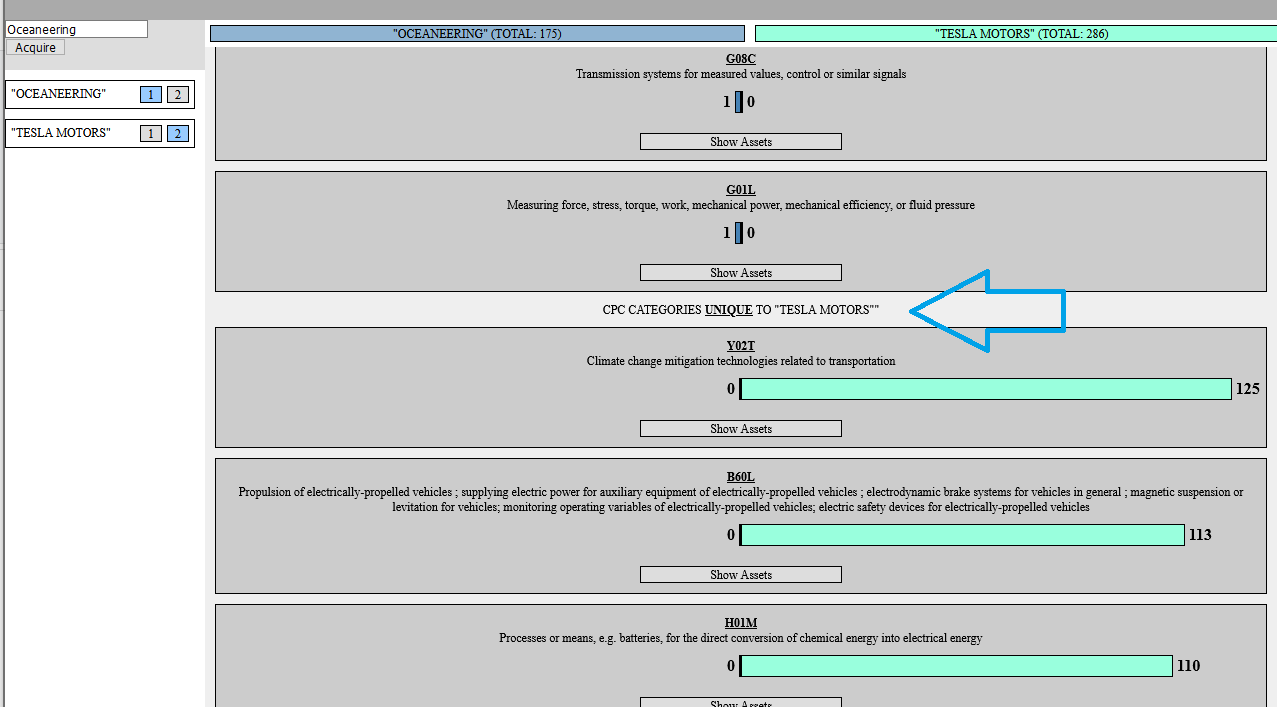
You'll see the unique results for the other query.
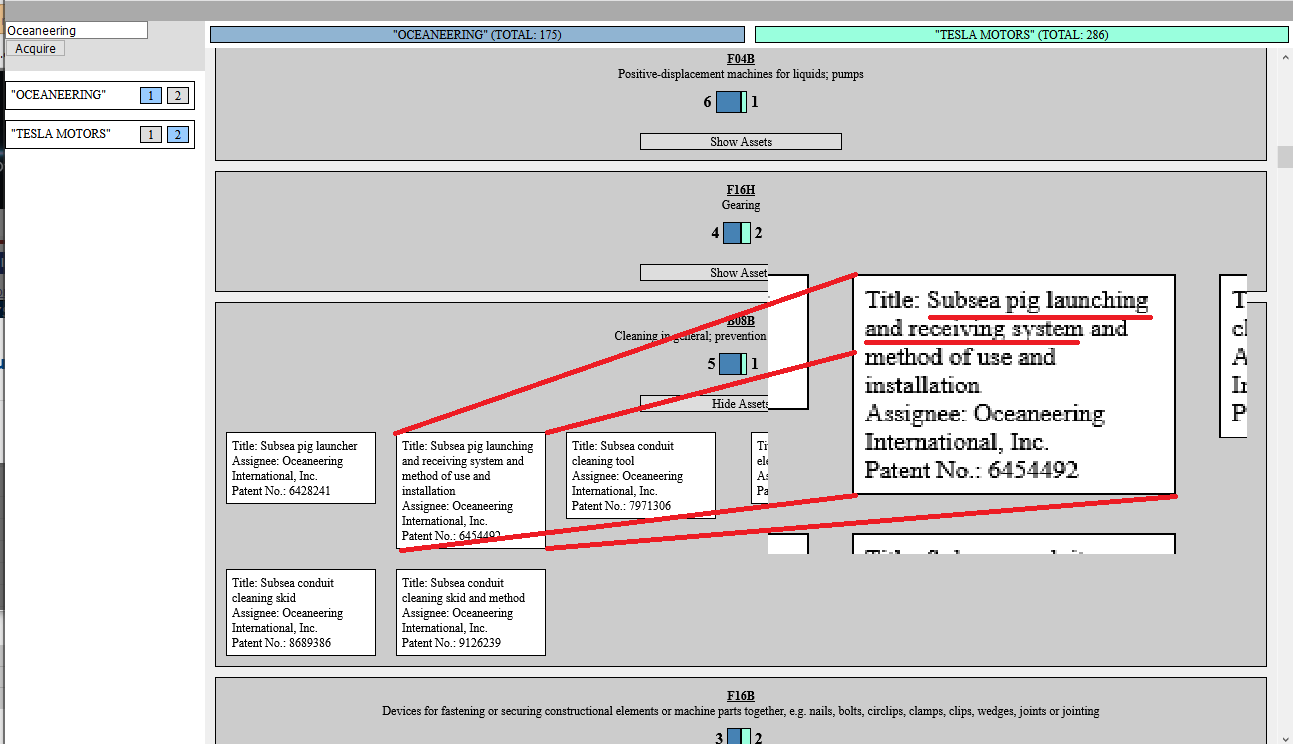
To look at the actual assets, click on "Show Assets":
Now if you look closely you'll . . . see . . . wait . . .
What in the . . .

Back on topic:
- EVEN though the USPTO data without cross-referencing is questionable; and
- EVEN though the CPC categorizations are imperfect; and
- EVEN though this crude demo is just doing a keyword search for entities; and
- EVEN though only patents are being covered . .
For example, Oceaneering Intl. and Tesla aren't really companies folks tend to discuss in the same breath. Despite that, their assets actually have a nontrivial amount of overlap in electrical circuitry, greenhouse emission reduction, non-electric control, etc. From a technical perspective, that may suggest opportunities, but as an investor or lendor, you can get a feel for secondary market value of an asset, bankruptcy sale opportunities, relative business priorities, joint venture discussion points, etc. Couple a simple tool like this with a more thorough cross-referencing system and interesting patterns can start to emerge.
Again, this tool is a pretty crude imitation of a real system (e.g., the search query doesn't exclude different entities with similar names, given an entity it doesn't look for subsidiaries, publications aren't considered, etc.), but I hope it still conveys the general opportunities such tools may provide.